Thursday, April 22, 2010

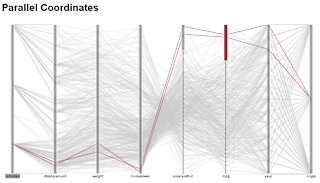
Parallel Coordinate Map


A parallel coordinate plot is a plot which shows the connection between multiple variables. By intertwining the data, a plot is created that shows how each variable is associated and the degree to which each is related.
Direct URL: http://perlitalabs.wordpress.com/2009/11/12/parallel-coordinate-visualization-with-protovis/

Star Plot


A star plot is a plot which shows a variables behavior in relation to all other variables. In other words, all variables can be seen in one star plot, helping to determine the overall relationship between each variable.
Direct URL: http://visalix.xrce.xerox.com/index.php?page=help

Correlation Matrix


A correlation matrix is a matrix which visualizes the strength correlation between multiple variables. The correlation between variables can be useful in determining whether or not one variable has an effect on the other.
Direct URL: http://yin.che.wisc.edu/images.htm

Similarity Matrix


A similarity matrix is a matrix which visualizes the strength of similarity between multiple variables. This is very useful when trying to determine which variable can be substituted for one another.
Direct URL: http://www.biomedcentral.com/1471-2164/8/353/figure/F5?highres=y

Stem and Leaf Plot


A stem and leaf plot is a histogram which measures variables as groups and applies them to a common measurement. In other words, stem and leaf plots represent the distribution of certain variables.
Direct URL: http://www.learner.org/courses/learningmath/data/session3/part_d/histogram.html

Box Plot


A box plot is a graph which uses boxes to represent variation in a measured variable. It also is useful in determining location in relation to the desired parameters.
Direct URL: http://www.itl.nist.gov/div898/handbook/eda/section3/boxplot.htm

Triangular Plot


A triangular plot is a graph in the shape of a triangle which measures a certain variables. Each corner represents a variable and the middle part of the triangular plot represents the connection between each variable.
Direct URL: http://www.pmel.noaa.gov/maillists/tmap/ferret_users/fu_2007/msg00384.html