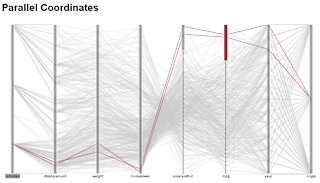
A parallel coordinate plot is a plot which shows the connection between multiple variables. By intertwining the data, a plot is created that shows how each variable is associated and the degree to which each is related.
Direct URL: http://perlitalabs.wordpress.com/2009/11/12/parallel-coordinate-visualization-with-protovis/


